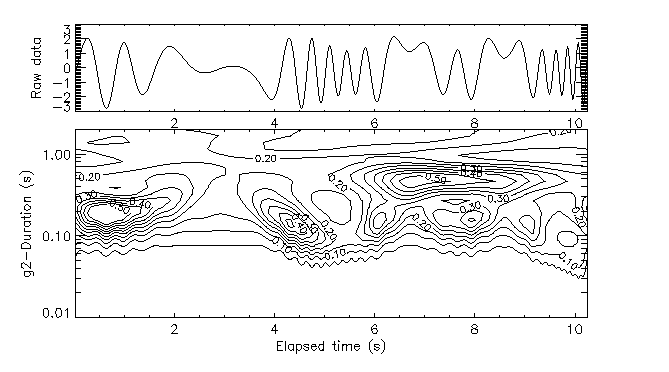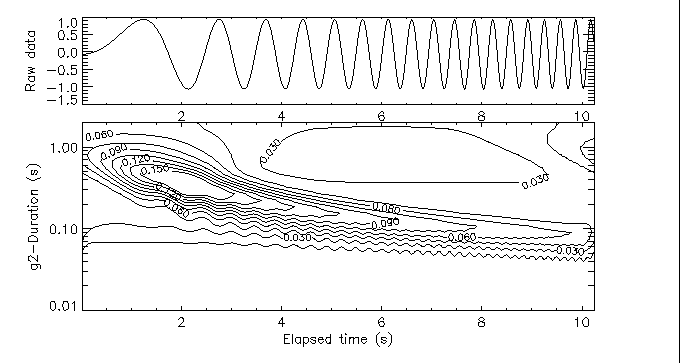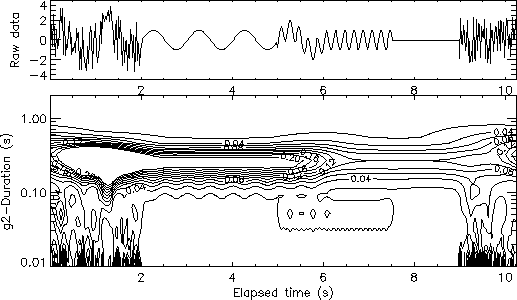


A sharp contrast is seen between the `crowded' energy map of the modulated oscillations (individual minima and maxima of the signal identified by the Mexican hat wavelet) in section 13 and and the `smooth' presentation of the norm-Morlet transforms of the same data in section 15. It may be of interest to keep the emphasis on individual events forming a sustained `wavetrain', but without assuming that the wavetrain is periodic. This can be achieved by the following simple algorithm:

 can be compared to the
Morlet-transform.


Differences with Figs 17-19 are seen in the vertical spread of the contours, with better spectral localization using the locally-periodic Morlet wavelet, and in the horizontal spread -- particularly for the modulated wave -- where single events can contribute.


