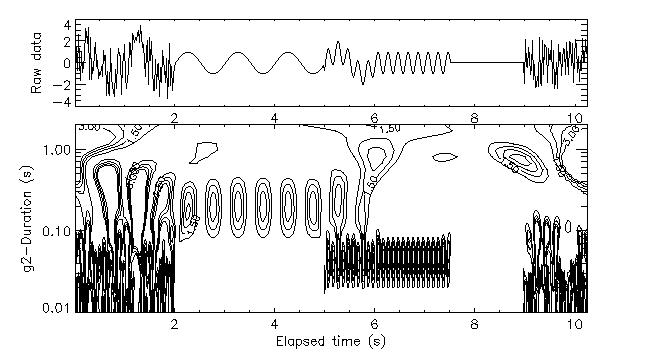


It is common for the high-frequency portion of a signal to be weaker (less energetic) than lower-frequency components. As a result, a common magnitude scale (contour lines on the maps above, or color scale on Fig.1) will poorly display the short-duration events in a signal. Normalizing each line of the map (fixed duration) so it has unit variance (in effect dividing the energy map by the mean energy spectrum) at each duration restores more details of small-scale activity (Fig. 24).


