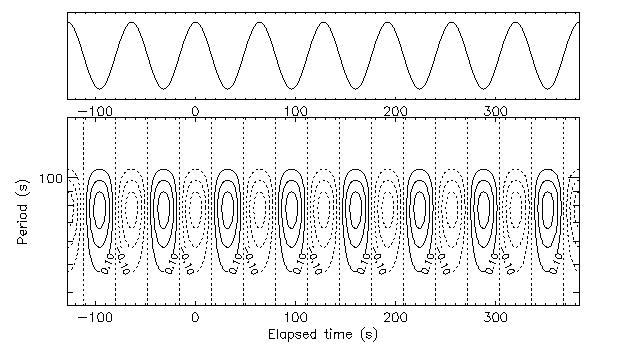


Therefore, we see that some spectral resolution is achieved by selection of the wavelet size, and some temporal resolution follows from the location of the wavelet relative to the signal (Fig. 6).

Analytically:

 factor is introduced for later convenience.
In the case of our cosine function, cos(at) in general, the transform can be calculated
exactly, and is

from which we can see the basic cosine echoing the original
signal, the power-law  showing a steep decrease in
magnitude toward larger
  's (short durations) and the
exponential drop-off toward small
  's (long durations)
Of course, the time ( ) and
duration (
 ) axis are discretized in
actual data processing. The result, a wavelet map, is shown
on Fig. 6.


