Interpretation:


Next: Energy distribution
Up: No Title
Previous: Continuous wavelet transforms
The wavelet map is a graphical representation of the function
 (sometimes called the wavelet coefficients) of two variables
 and
and  for a given wavelet. Large values of the function (the
so-called wavelet coefficients) reflect the combined effects of
a large fluctuation of the signal f at this time and of a
good matching of shape between the signal and the wavelet. It
can be noted that the Mexican hat wavelet used so far isolates
local minima and maxima of the signal at the selected duration.
This feature must be kept in mind when interpreting the wavelet map.
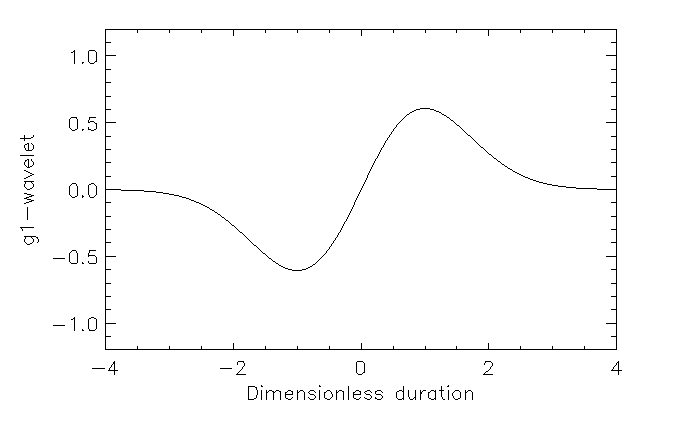
For example when we use the antisymmetric wavelet (Fig. 7)

Figure 7: The antisymmetric wavelet g1.

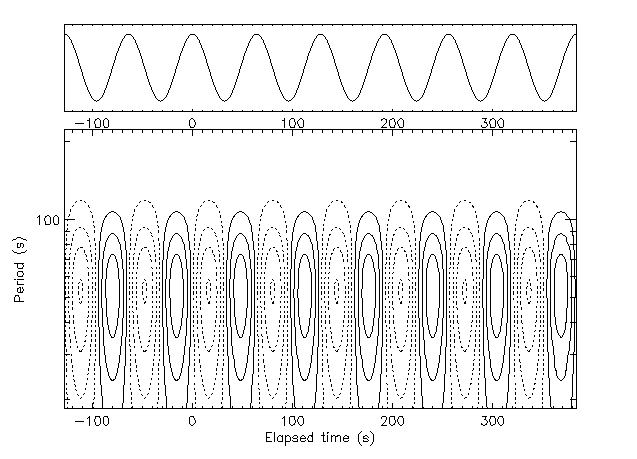
and repeat the construction of the wavelet map, we observe many
similarities and a general `phase shift' associated with the new
emphasis on slopes of the signal (Fig. 8).

Figure 8: g1-wavelet map of the cosine picks out gradients of the signal.
In fact,  specializes in
the extraction of gradients from the signal.
Analytically, we get

and the `phase shift' between the signal and transform is clear
from the presence of the sine function.
The relation between the Gaussian wavelet transforms (those
with  and
and
 ) and successive derivatives of a smoothed
signal is easily established. Define the smoothing by a
Gaussian kernel of duration
  by the formula

where

For our cosine signal, we have

Note that  is not a wavelet, since the area under the
 curve is non-zero.
Differentiations of  and
integrations by parts yield, successively:

i.e. the slope of the smoothed signal at scale k, and

is the second derivative of the smoothed signal.


Jacques Lewalle
Mon Nov 13 10:51:25 EST 1995
 (sometimes called the wavelet coefficients) of two variables
 and
and  for a given wavelet. Large values of the function (the
so-called wavelet coefficients) reflect the combined effects of
a large fluctuation of the signal f at this time and of a
good matching of shape between the signal and the wavelet. It
can be noted that the Mexican hat wavelet used so far isolates
local minima and maxima of the signal at the selected duration.
This feature must be kept in mind when interpreting the wavelet map.


 specializes in
the extraction of gradients from the signal.

 ) and successive derivatives of a smoothed
signal is easily established. Define the smoothing by a
Gaussian kernel of duration
  by the formula


 is not a wavelet, since the area under the
 and
integrations by parts yield, successively:

